Background
Till now, we use perf/perf_event to profile our
Java programs in production, but recently people talk more and more about
eBPF, which
seems more efficient. So I tried how to profile our Java program by using eBPF,
more specifically, by using iovisor/bcc.
I’ll share you how to do this in this post.
Prerequisites
In general, there’re 3 steps to achive a cpu profiling flame graph.
Step 1. Populate symbol table map
This is only needed when comes up to JIT compilers, languages which don’t
have a JIT compiler won’t need this step, unfortunately, Java does need
this.
perf-map-agent must be
ready for this step. To be more precise, we need libperfmap.so and attach-main.jar files
which is generated after a make command in this repo.
I’ll make a Docker image to deal with the profiling process, so I ADD these two generated files in my Dockerfile.
Step 2. Profile
It’s obvious that we need bcc tools in this step.
If you use CentOS like me, you can
1
|
yum install -y bcc-tools
|
to get bcc installed, and the executable scritp we’ll use: profile locates at
/usr/share/bcc/tool/profile.
Step 3. Draw a flame graph
We’ll draw a flame graph to help
us better understand the output, so FlameGraph by Brendan Gregg
is needed.
Routines
Setup perf-agent container
As I said, I’ll do this in a container, you’re welcome to do the same thing on
the host directly.
1
|
docker run -it --rm --pid=host --network=host --privileged=true -v /var/run/docker.sock:/var/run/docker.sock perf-agent:base bash
|
This is the Dockerfile to make perf-agent:base image:
1
2
3
4
5
6
7
8
|
FROM centos

ADD libperfmap.so /root/perf-map-agent/
ADD attach-main.jar /root/perf-map-agent/
RUN yum upgrade -y && yum install -y docker bcc-tools
RUN cd /root && git clone --depth=1 https://github.com/brendangregg/FlameGraph && \
    mkdir -p /lib/modules/4.14.67-2dev917.el7.x86_64 && \
    ln -s /usr/src/kernels/4.14.67-2dev917.el7.x86_64 /lib/modules/4.14.67-2dev917.el7.x86_64/build
|
As you can see I make a soft link to kernel packages, it’s important to make
these packages exist if you need to use bcc.
1
|
ln -s /usr/src/kernels/4.14.67-2dev917.el7.x86_64 /lib/modules/4.14.67-2dev917.el7.x86_64/build
|
Do profiling job
As our Java programs are running in containers, so first of all we need to get
the container id and the pid of the program which is not a big deal. So suppose
we have:
1
2
|
export PID=66598
export CTN_ID=bc8ea729e674
|
- Populate symbol table for Java
 1
 2
 3
 4
 5
 6
 7
 8
 9
10
11
12
13
14
|
export JAVA_HOME=`docker exec ${CTN_ID} java -XshowSettings:properties -version 2>&1 > /dev/null | grep 'java.home' |cut -d'=' -f2|sed -e 's/\/jre//' | xargs`
export JAVA_BIN=`docker exec ${CTN_ID} ps -ef | grep /bin/jav[a] | awk '{print \$8}'`
export JAVA_PID=`docker exec ${CTN_ID} ps -ef | grep ${JAVA_BIN} | awk '{ print \$2 }'`
export JAVA_UID=`docker exec ${CTN_ID} ps -e -o pid,uid,gid,command | grep ${JAVA_BIN} | awk '{ print \$2 }'`
export JAVA_GID=`docker exec ${CTN_ID} ps -e -o pid,uid,gid,command | grep ${JAVA_BIN} | awk '{ print \$3 }'`

# We copy libperfmap.so and attach-main.jar to target container
docker cp /root/perf-map-agent ${CTN_ID}:/tmp/perf-map-agent

# Command to populate a /tmp/perf-PID.map file with the symbols
docker exec --user "${JAVA_UID}":"${JAVA_GID}" "${CTN_ID}" bash -c "cd /tmp/perf-map-agent && java -cp /tmp/perf-map-agent/attach-main.jar:${JAVA_HOME}/lib/tools.jar net.virtualvoid.perf.AttachOnce ${JAVA_PID}"

# Copy back to our perf container
docker cp ${CTN_ID}:/tmp/perf-${JAVA_PID}.map /tmp/perf-${PID}.map
|
- Proflile
1
2
|
# We profile 15 seconds
/usr/share/bcc/tools/profile -adf -p $PID 15 > $PID.profile
|
- Generate flame graph
1
|
/root/FlameGraph/flamegraph.pl < $PID.profile --colors java --hash > $PID.svg
|
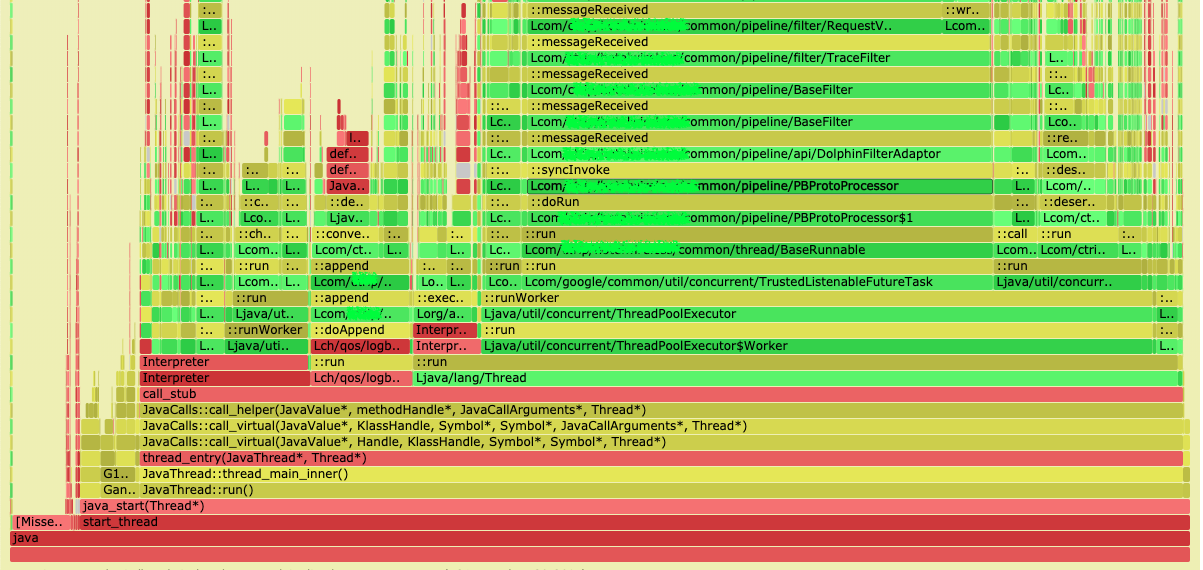
By now, you can see a flame graph like:
I put out a bash script here as a conclusion to all above steps.
 1
 2
 3
 4
 5
 6
 7
 8
 9
10
11
12
13
14
15
16
17
18
19
20
21
22
23
24
25
26
27
|
#!/bin/sh

set -ex

PID=66598
CTN_ID=bc8ea729e674
JAVA_HOME=`docker exec ${CTN_ID} java -XshowSettings:properties -version 2>&1 > /dev/null | grep 'java.home' |cut -d'=' -f2|sed -e 's/\/jre//' | xargs`
JAVA_BIN=`docker exec ${CTN_ID} ps -ef | grep /bin/jav[a] | awk '{print \$8}'`
JAVA_PID=`docker exec ${CTN_ID} ps -ef | grep ${JAVA_BIN} | awk '{ print \$2 }'`
JAVA_UID=`docker exec ${CTN_ID} ps -e -o pid,uid,gid,command | grep ${JAVA_BIN} | awk '{ print \$2 }'`
JAVA_GID=`docker exec ${CTN_ID} ps -e -o pid,uid,gid,command | grep ${JAVA_BIN} | awk '{ print \$3 }'`


# We copy libperfmap.so and attach-main.jar to target container
docker cp /root/perf-map-agent ${CTN_ID}:/tmp/perf-map-agent

# Command to populate a /tmp/perf-PID.map file with the symbols
docker exec --user "${JAVA_UID}":"${JAVA_GID}" "${CTN_ID}" bash -c "cd /tmp/perf-map-agent && java -cp /tmp/perf-map-agent/attach-main.jar:${JAVA_HOME}/lib/tools.jar net.virtualvoid.perf.AttachOnce ${JAVA_PID}"

# Copy back to our perf container
docker cp ${CTN_ID}:/tmp/perf-${JAVA_PID}.map /tmp/perf-${PID}.map

# We profile 15 seconds
/usr/share/bcc/tools/profile -adf -p $PID 30 > $PID.profile

# Draw flamegraph
/root/FlameGraph/flamegraph.pl < $PID.profile --colors java --hash > $PID.svg
|
References
Great expects and thanks to Brendan Gregg for his marvelous work about
FlameGraph, bcc and so on.
